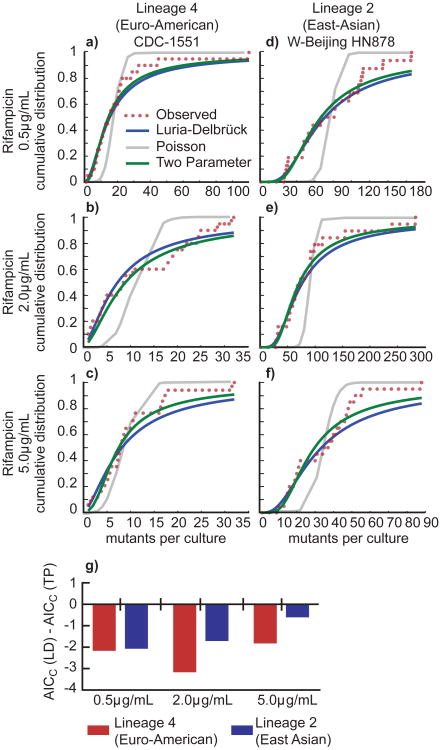
Figure 3. The cumulative distribution of drug resistant mutants from both lineages indicates that mutations do not occur after exposure to antibiotic.
(a) Curve fitting analysis was performed to determine if the cumulative distribution of the fluctuation analysis data from Lineage 4 strain CDC-1551 plated on rifampicin, 0.5μg/mL better fit a one-parameter Luria-Delbrück (LD) model, a one parameter Poisson model (Poiss), or a two-parameter Luria-Delbrück and Poisson mixture model (TP). The number of mutants per culture is displayed on the x-axis, and the probability of observing x or fewer mutants per culture is shown on the y-axis. (b) Fitting as in (a) for Lineage 2 strain HN878 plated on rifampicin, 0.5μg/mL. (c) Fitting as in (a) for Lineage 4 strain CDC-1551 plated on rifampicin, 2μg/mL. (d) Fitting as in (a) for Lineage 2 strain HN878 plated on rifampicin, 2μg/mL. (e) Fitting as in (a) data for Lineage 4 strain CDC-1551 plated on rifampicin, 5μg/mL. (f) Fitting as in (a) data for Lineage 2 strain HN878 plated on rifampicin, 5μg/mL. (g) To determine which model best fit each data set, we determined the Akaike Information Criterion, corrected for small sample size (AICC). A smaller AICC represents a better fit, given a penalty for more parameters in a model. If the AICC(LD) is smaller than the AICC(TP), then the resulting value will be negative, reflecting a better fit for the LD model (see Supplementary Table 2).

