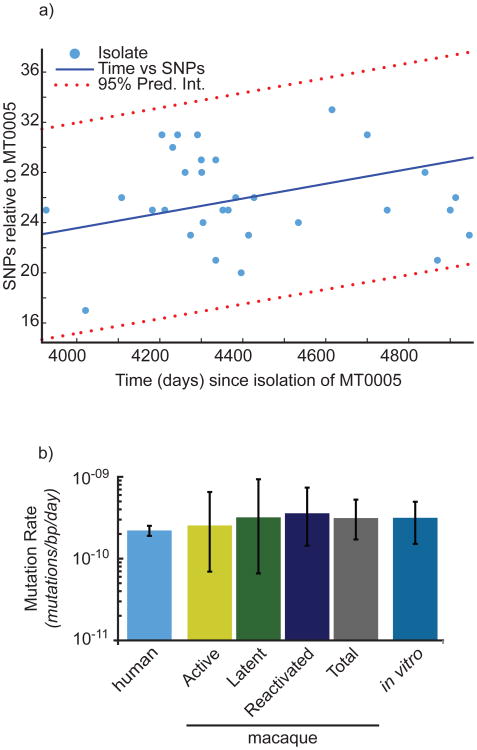
Figure 6. Bayesian MCMC analysis reveals a mutation rate in humans similar to that estimated in strains from the macaque model and in vitro.
(a) The number of SNPs and the number of days separating the clinical isolate and MT0005 are plotted. SNPs located in repeat regions (PE_PGRSs, PPEs, and transposable elements) were excluded, consistent with our previous analysis6. The data are fit to a first order polynomial to illustrate the trend. (b) Estimates of mutation rate in human isolates were derived by reconstructing the phylogeny from the isolates represented in (a). Mutation rate is shown on the y-axis in log scale. Estimates of mutation rate from the macaque model and the infecting strain, Erdman (in vitro) were determined previously6. Error bars represent 95% confidence intervals.

