
FIGURE 1.
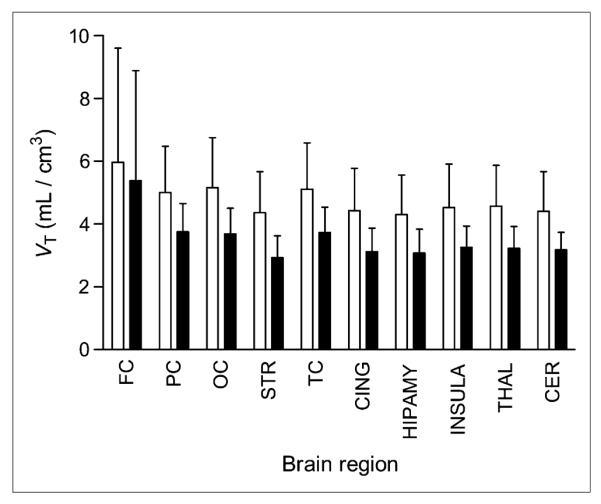
Decreased binding of TSPO as measured by VT of 11C-PBR28 across brain regions. Relative to baseline scans (white bars), VT is about 26% (P = 0.011) lower in scans with propofol anesthesia (black bars). Error bars denote SD. FC = frontal cortex; PC = parietal cortex; OC = occipital cortex; STR = striatum; TC = temporal cortex; CING = cingulum; HIPAMY = hippocampus-amygdala; INSULA = insula; THAL = thalamus; CER = cerebellum.