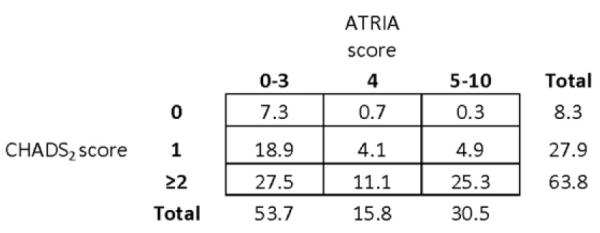
Figure 2.

Overall distributions of CHADS2 and ATRIA scores. Shown are the distributions of stroke risk according to CHADS2 and bleeding risk according to ATRIA scores. The numbers in each box represent the percentage of patients in the total study population with the given CHADS2 and ATRIA scores.
