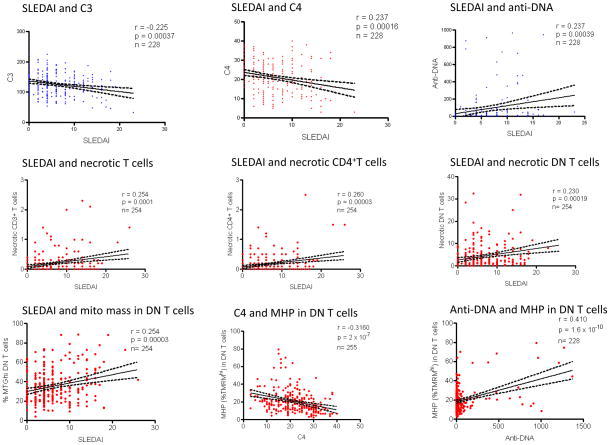
Fig. 4.
Correlation of SLEDAI and traditional biomarkers of disease activity, such as C3, C4, and anti-DNA, with 212 metabolic, cell surface, and gene expression biomarkers during 274 visits of 59 patients with SLE. Due to missing data, the actual number of available data pairs are indicated for each comparison (n = 228–255). Correlation r values were considered significant at p < 0.000236 when corrected for multiple comparisons (0.05/212). Correlation p values above and below 0.000236 are indicated in blue and red symbols, respectively.

