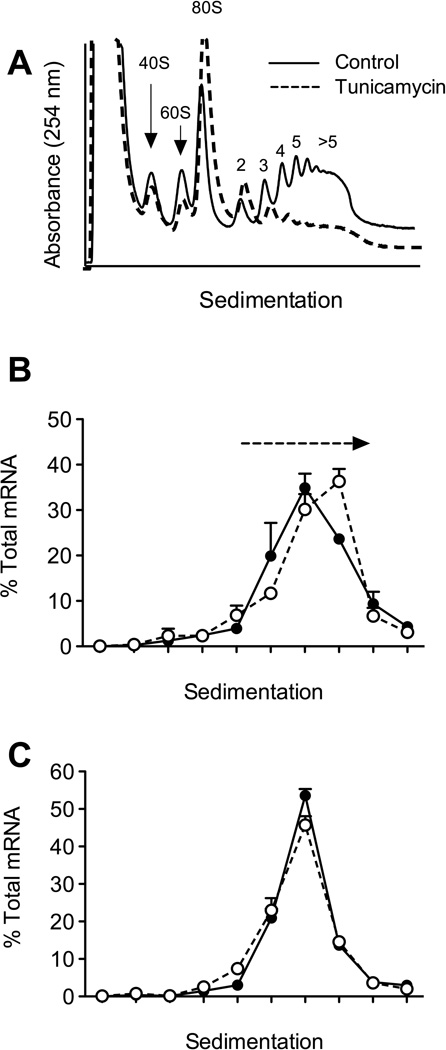
Figure 3. Tunicamycin induces translation initiation blockade.
Mouse-derived MIN6 β-cellswere either incubated with 5 µM Tunicamycin or carrier (Control, dimethylsulfoxide) for 24 hours, then extracts were subjected to polyribosome profiling (PRP) analysis through sucrose gradients as described in ref. 35. Fractions from the PRP analysis were collected and subjected to RNA isolation and reverse transcription real-time PCR analysis. A, PRP profiles of Control (solid line) and Tunicamycin-treated (dashed line) MIN6 β-cell s. B, fractions from the PRP analysis of Control (solid line) and Tunicamycin (dashed line)-treated MIN6 cells were quantitatively analyzed for Atf4 mRNA. Dashed arrow indicates the rightward shift of Atf4 message to higher polyribosomes following Tunicamycin treatment. C, fractions from the PRP analysis of Control (solid line) and Tunicamycin (dashed line)-treated MIN6 cells were quantitatively analyzed for Ins1/2 mRNA.

