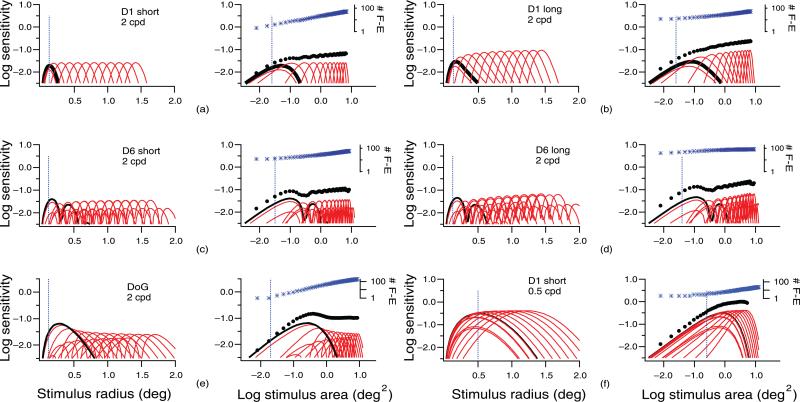
Figure 3.
The left column in each panel shows log sensitivity versus stimulus radius for individual filter-elements at different offsets from the stimulus center. The black curve shows the tuning function for the filter-element centered on the stimulus. The dashed vertical line indicates the stimulus radius corresponding to 1/2 cycle of the peak spatial frequency. The right column in each panel shows reconstructed spatial summation functions for single mechanisms with filter-element (F-E) tuning functions scaled vertically to represent effects of probability summation; at the top of each figure, the asterisks show the number of filter-elements responding to each stimulus size. The filled circles are the probabilistic sums of the sensitivities of the filter-elements. The black curve shows the function for the filter-element centered on the stimulus. The dashed vertical line indicates the critical area. See text for details.

