
Fig. 2.
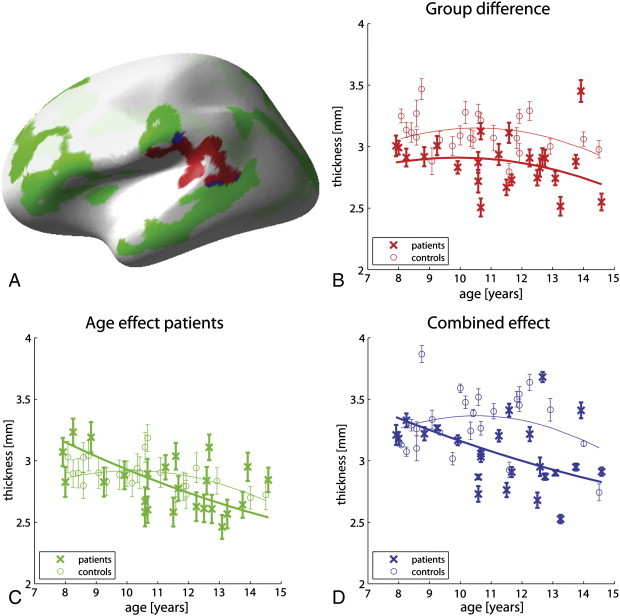
Aberrant cortical development in rolandic epilepsy.
A: Color-coded depiction of abnormalities in cortical thickness in children with rolandic epilepsy. Regions in which patients show reduced cortical thickness are depicted in red, regions in which patients display cortical thinning with age are given in green, and overlap between the two is depicted in blue. For these 3 types of regions, cortical thickness is plotted against age in the same colors in subfigures B, C and D, respectively, for both the patient and the control cohorts. Subfigures C and D reveal linear trends of decreasing cortical thickness with age for the patient group only; the control cohort seems to be in the transition from cortical thickening to cortical thinning . Error bars indicate 1 standard error of spatial variance and for visualization purposes, quadratic fits are provided in addition to the data points.