
Fig. 5.
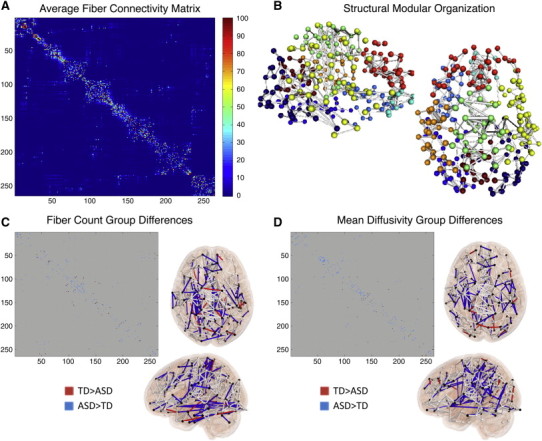
Structural network organization. (A) Average structural connectivity matrix reorganized by its modular organization. (B) Three dimensional sagittal and axial views of the structural network in anatomical space displaying top 2% of connections. (C) Structural connectivity matrix group differences (p < 0.05, uncorrected) displaying typically developing (TD) > Autism Spectrum Disorder (ASD) for fiber counts and (D) mean diffusivity in the connectivity matrix and in 3D brain space.