
Fig. 6.
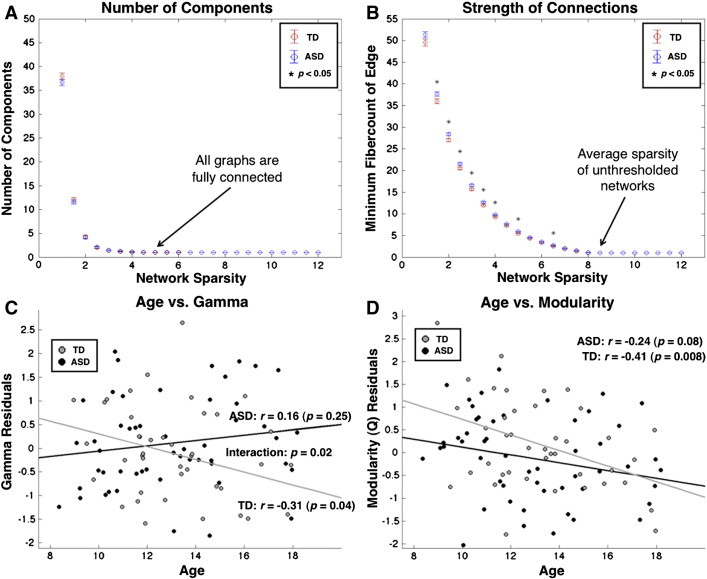
Graph theoretical metrics of structural networks. (A) Average and standard error for TD (red) and ASD (blue) number of components, (B) minimum fiber count for edges, as a function of network sparsity. Number of components and minimum correlation strength are shown between 1% and 12% network sparsity in 0.5% increments. Significant between group differences (p < 0.05) are indicated by *. Gamma (C) and modularity (D) residuals after regressing out mean and relative values are displayed as a function of age in the TD (gray) and ASD (black) groups.