
Fig. 1.
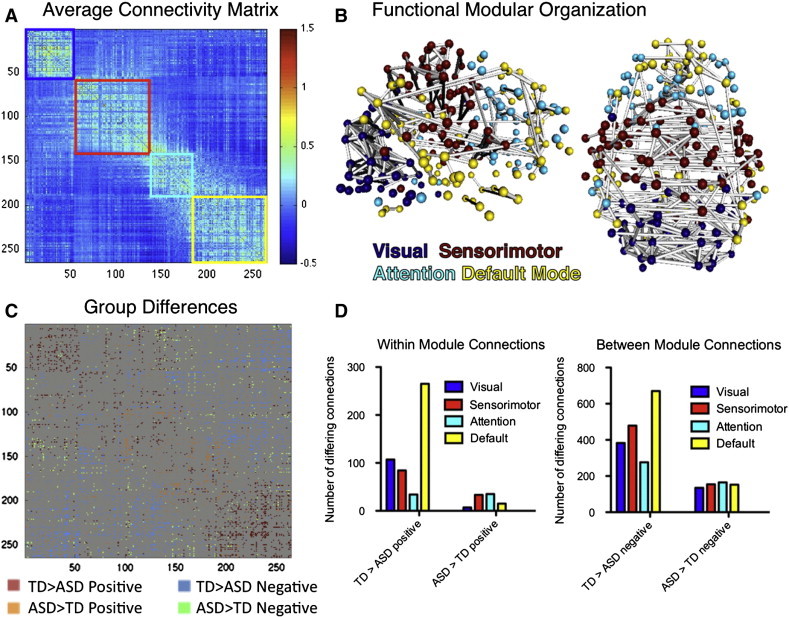
Functional network organization. (A) Average functional connectivity matrix reorganized by its modular organization with colored boxes around each of the four communities (visual = blue, sensorimotor = red, attention/control = cyan, and default = yellow). (B) Three dimensional sagittal and axial views of the functional graph in anatomical space displaying top 2% of connections and nodes colored by community. (C) Functional connectivity matrix group differences (p < 0.05 uncorrected) displaying typically developing (TD) > Autism Spectrum Disorder (ASD) for positive (red), ASD > TD for positive (orange), TD > ASD for negative (blue) and ASD > TD for negative (green). (D) Numbers of TD > ASD and ASD > TD between group connections differing for within group positive connections (left) and between group negative connections (right).