
Fig. 3.
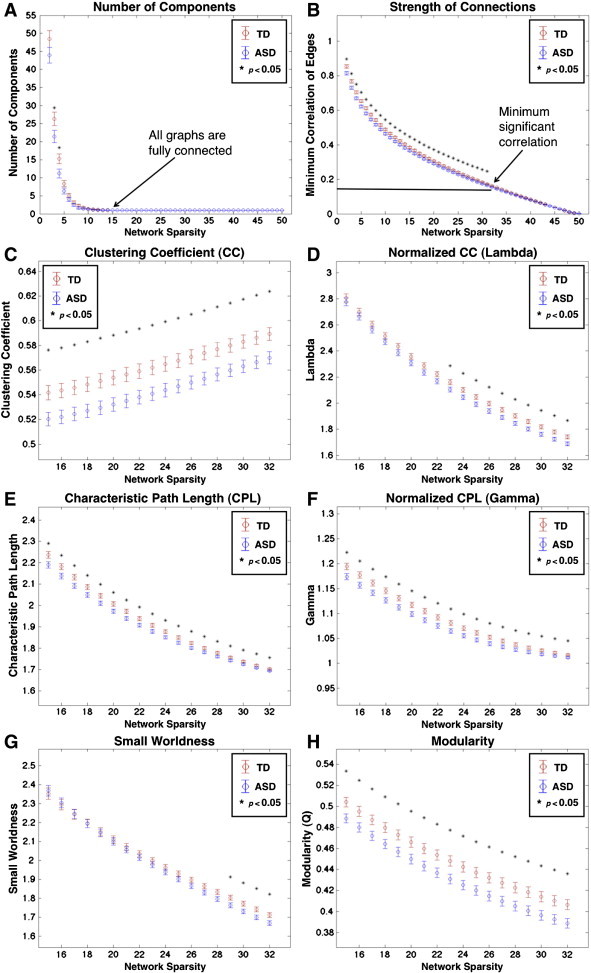
Graph theoretical metrics of functional networks. (A) Average and standard error for TD (red) and ASD (blue) number of components, (B) minimum correlation coefficient for edges, (C) clustering coefficient, (D) gamma, (E) characteristic path length, (F) lambda, (G) small worldness and (H) modularity Q values as a function of network sparsity. Number of components and minimum correlation strength are shown between 1% and 50% network sparsity in 1% increments while other network properties are displayed between 15% and 32% network sparsity in 1% increments (equivalent to minimum correlation values of 0.34 and 0.15). Significant between group differences (p < 0.05) are indicated by *.