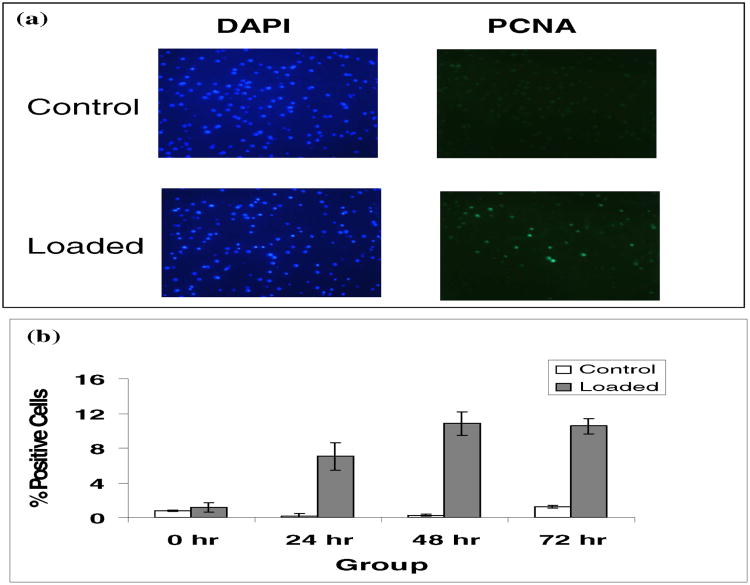
Fig. 2. Immunofluorescent staining.
5 μm-thick tissue sections were treated with monoclonal antibody for proliferating cell nuclear antigen (PCNA, 1:50), and subsequently incubated with Cy2-conjugated AffiniPure goat anti-mouse IgG secondary antibody (1:50) to allow for visualization of proliferating cells under blue light (a. right panel). Cover slips were then mounted using Prolong Gold anti-fade reagent with DAPI to allow for visualization of all cellular nuclei using UV light (a. left panel). Specimens were visualized at 200× magnification, and images were captured, saved, and then analyzed using a computer grid. Total cells (DAPI labeled as bright blue) were counted in control and loaded groups. PCNA positive cells (PCNA-Cy2 labeled as green) were then counted for the same field. Results were expressed as the percentage of PCNA positive cells per total DAPI positive cells (b). There were six explants for each experimental group at all the points. Note: The asterisk (*) represents statistical significance (P<0.05) compared to control. Error bars represent standard deviation.

