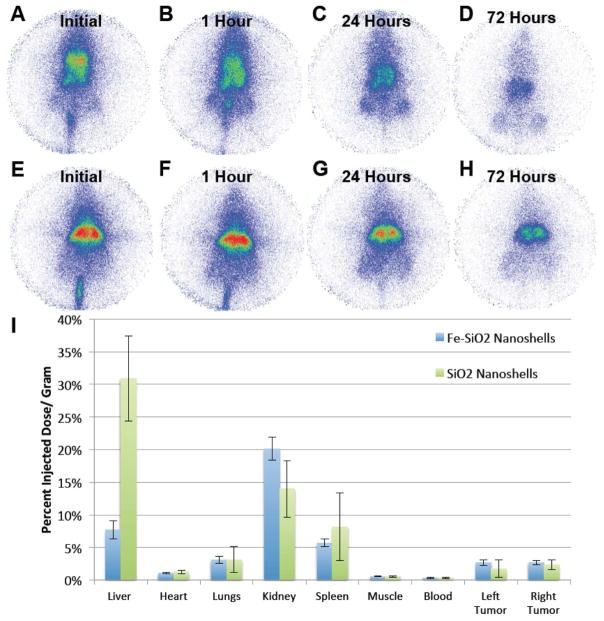
Figure 5. Biodistribution of radiolabeled 500 nm Fe-SiO2 and SiO2 nanoshells in Py8119 tumor bearing nu/nu mice with IV delivery.
Py8119 tumor bearing mice were injected intravenously with 100 μl of 111In labeled gas filled 500 nm Fe-SiO2 nanoshells (A–D) and SiO2 nanoshells (E–H) then imaged by gamma scinitigraphy. A) Imaging during the injection. B) Imaging 1 hour post injection. C) Imaging 24 hours post injection D) Imaging 72 hours post injection. E) Imaging during the injection. F) Imaging 1 hour post injection. G) Imaging 24 hours post injection. H) Imaging 72 hours post injection. I) Gamma counter readings of harvested organs and tumors for Fe-SiO2 and SiO2 nanoshells. Error bars are the standard deviations.

