
Figure 6.
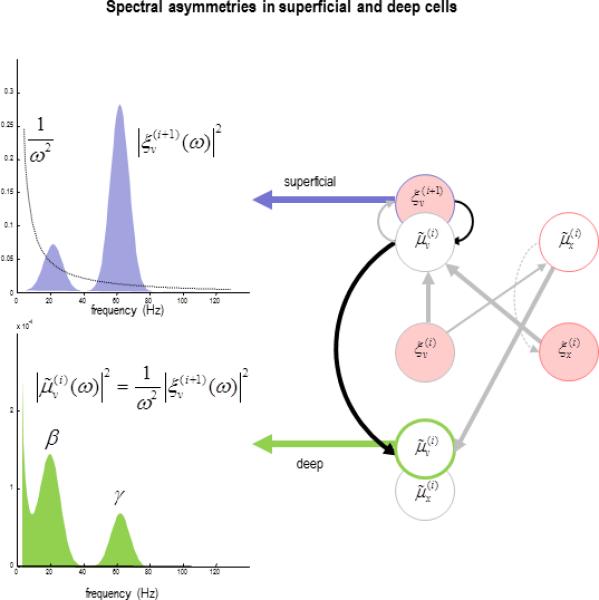
This schematic illustrates the functional asymmetry between the spectral activity of superficial and deep cells predicted theoretically. In this illustrative example, we have ignored the effects of influences on the expectations of hidden causes (encoded by deep pyramidal cells), other than the prediction error on causes (encoded by superficial pyramidal cells). The lower panel shows the spectral density of deep pyramidal cell activity, given the spectral density of superficial pyramidal cell activity in the upper panel. The equation expresses the spectral density of the deep cells as a function of the spectral density of the superficial cells; using Equation (2). This schematic is meant to illustrate how the relative amounts of low (beta) and high (gamma) frequency activity in superficial and deep cells can be explained by the evidence accumulation implicit in predictive coding.