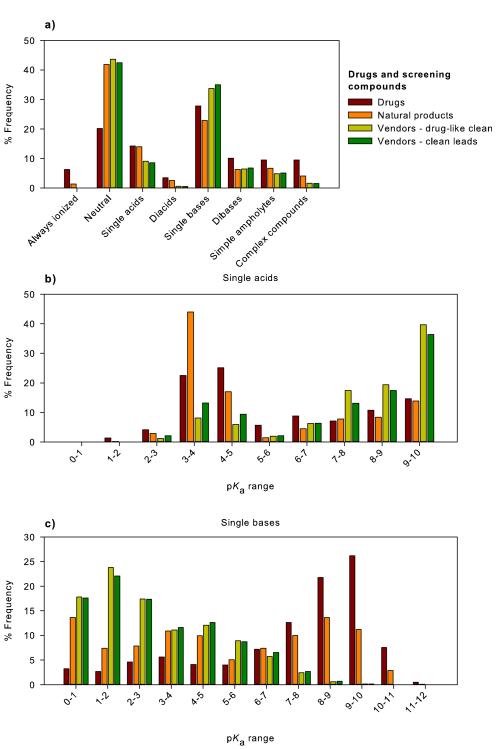
Figure 8.
(A) Contrasting differences in charge state categories between the drugs, compound suppliers (Vendors – drug-like clean, vendors – clean leads) and natural products datasets. pKa distributions of compounds containing a (B) single acidic or (C) single basic functional group; drugs, compound suppliers (Vendors – drug-like clean, vendors – clean leads) and the natural products dataset.

