
Fig. 2.
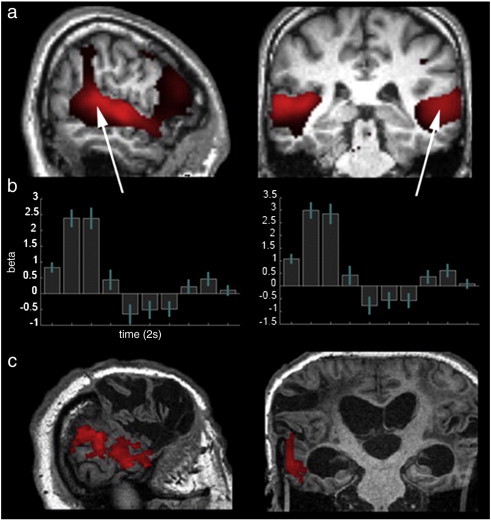
Temporal lobe activation subsequent to presentation of the auditory stimuli. a) In controls, the main effect of time rendered extensive activation subtending the superior temporal gyrus bilaterally (image rendered at p < 0.05 FDR corrected for the whole brain mass). b) The timecourse data from 5 mm spherical ROIs positioned at the peak activation coordinates within the temporal lobes. The BOLD response was strongest in the first three time bins (error bars report the 90% confidence interval. c) In the patient analysis, contrasting the first three time bins, where the temporal response was greatest in controls, vs. the rest of the timecourse, rendered significant activation in the left STL (image thresholded at t > 2.35 and FWE cluster corrected at p < 0.05).