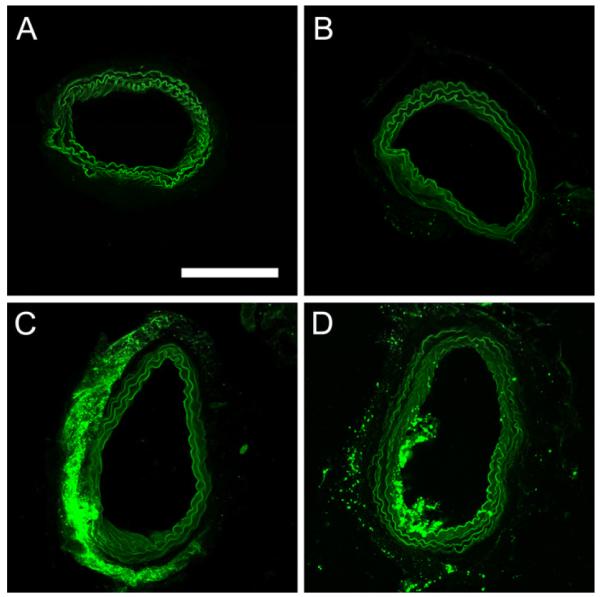
Figure 3.
Fluorescence images of representative slices from arteries incubated with A - FITC-dextran alone, no ultrasound; B, C, D - FITC-dextran with nanodroplets. B - no ultrasound (group 2); C – CW ultrasound (group 4); and D – pulsed ultrasound (group 5). Scale bar (0.2 mm) applies to all images.

