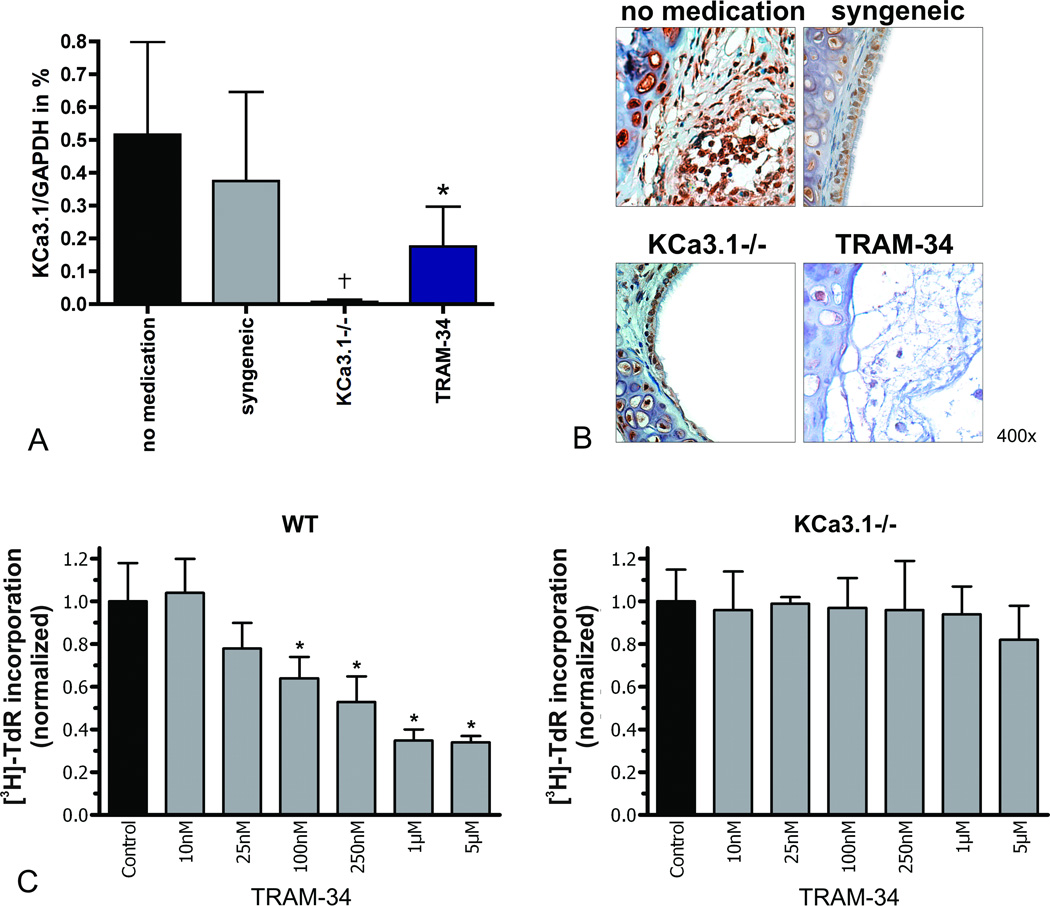
Figure 4. KCa3.1 expression and in vitro proliferation assay.
KCa3.1 mRNA-expression in tracheal grafts was analyzed by semi-quantitative RT-PCR (A; *p<0.008; †p<0.001 vs. no medication (N=6), N=4 for syngeneic, N=8 for KCa3.1−/−, N=5 for TRAM-34). Representative stainings for the KCa3.1 channel in tracheal graft are shown at a magnification of 400× (B). The results of the in vitro proliferation assay for WT or KCa3.1−/− splenocytes are shown as [3H]-TdR incorporation normalized to the ConA-stimulated controls (C; *p<0.05 vs.controls).

