
Fig. 2.
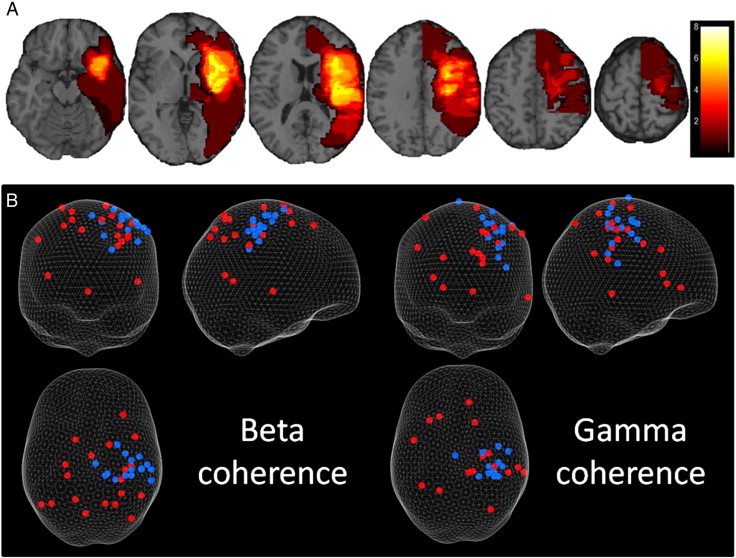
Lesion overlap and CMC coordinates on glass brain. A) Lesion overlap of stroke patients from axial slices on a template brain demonstrating the variety in cortical and subcortical damage across the group. Scale indicates number of patients overlapping. B) 3D plot of peak coherence coordinates for beta (left) and gamma (right) (grip performed with left hand — right hand grips were flipped in the sagittal plane so that all data could be included on the same plot). Control subjects are shown in blue and patients are shown in red. Results are displayed on a ‘glass brain’ and shown from behind (top left), from the right side (top right) and from above (bottom left). These peaks of CMC were calculated using a DICS beamformer.