
Supplementary Fig. S1.
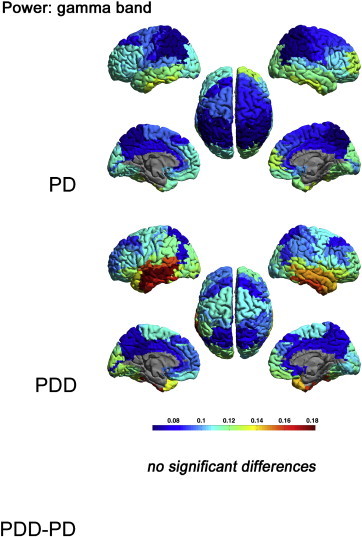
Relative power, shown as a colour-coded map on a template mesh, for the PD and PDD groups in the gamma band. No significant differences were found in the gamma band between groups using permutation analysis (global-threshold). The left hemisphere is shown on the left.