
Fig. 2.
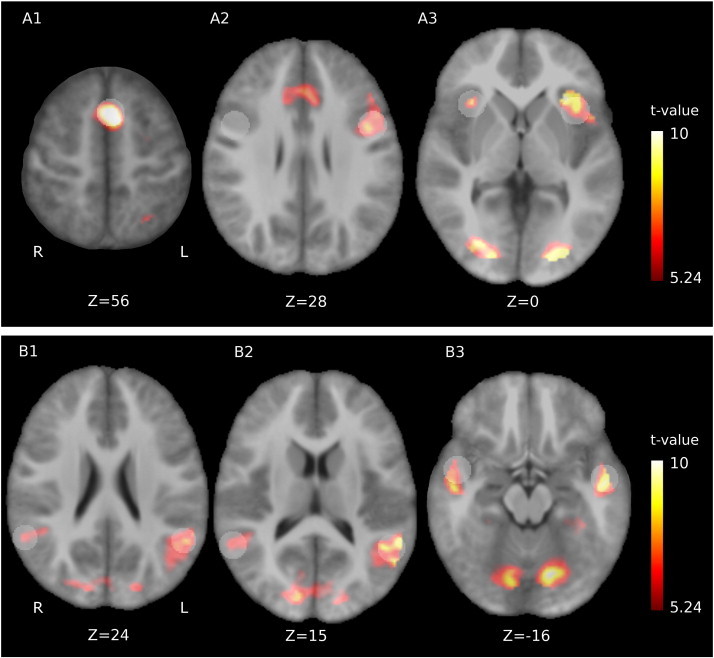
Activation maps. Pooled activation maps (i.e. patients and controls combined) for A: word-generation and B: reading. In word-generation, the anterior cingulate cortex (A1), left inferior prefrontal cortex (A2) and bilateral insular regions (A3) were activated. Reading induced activity in posterior (B1–2) and anterior (B3) bilateral mid temporal regions. Z-values indicate MNI slice coordinates, the colorbar gives the activation t-statistic and activation maps are given for p < 0.05 (family-wise error (FWE) corrected). Regions of interest are overlaid in transparent white, the one in the right inferior prefrontal cortex (A2) was constructed by mirroring with respect to the median plane. Z-values indicate axial MNI coordinates.