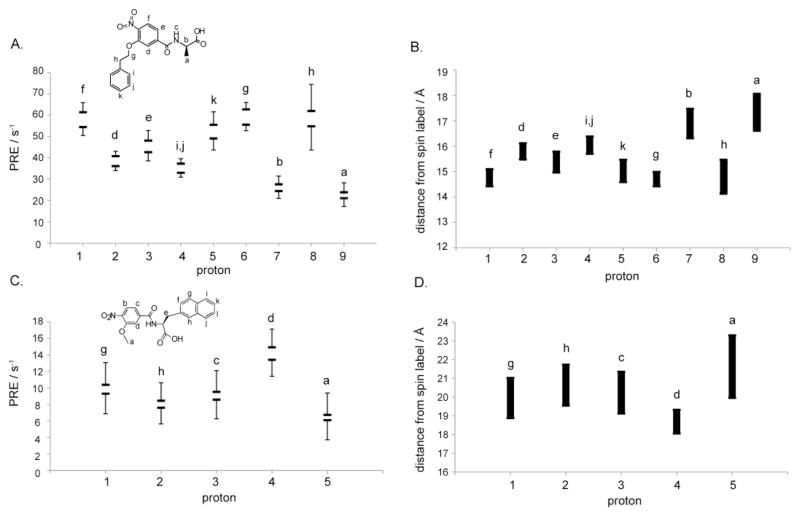
Figure 7.
Experimental PRE and corresponding distance ranges calculated at 12ns τc for O2N-[HoPhe]-Ala-OH (A, B) and O2N-[Ala]-Nap-COOH (C, D). In A and C, horizontal bars represent the PRE values obtained assuming maximum or minimum values for fb and fb′, and the error bars indicate the sum of the errors in line fitting of diamagnetic and paramagnetic data (see Figure 4).

