
Fig. 6.
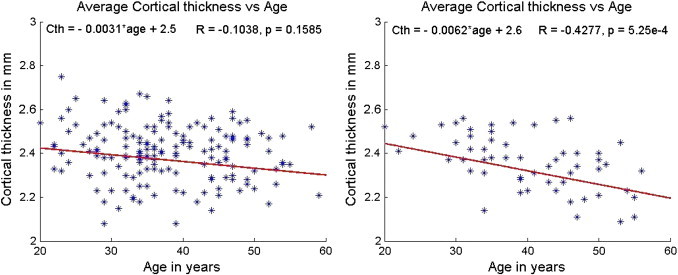
Average cortical thickness as a function of age in MS patients (left — female, right — male). The slope and intercept are reported on the top left corner and the R and p values based on Spearman correlation are on the top right corner. The scales have been matched for illustration purposes.