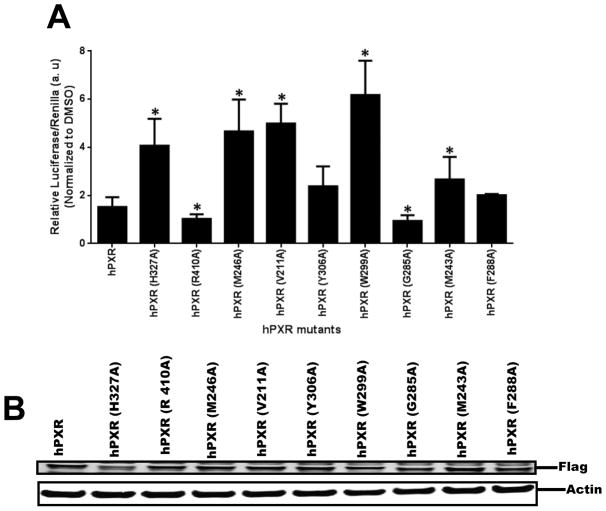
Figure 15. Comparison of hPXR and hPXR mutants upon 5 μM compound 1 treatment.
(A) HepG2 cells transiently transfected with hPXR or hPXR mutants, CYP3A4-luc, and CMV-Renilla were treated for 24 h with indicated concentrations of compound 1 prior to luciferase assay. The relative luciferase units (a.u.) were determined by normalizing with the Renilla luciferase control. (B) The expression of hPXR or hPXR mutants upon compound 1 treatment. Actin expression level was used to verify equal loading of lysates. The values represent the means of three independent experiments, and the bars denote the S.D. * Indicates p < 0.05 (comparisons were made between PXR mutant and WT hPXR).

