Figure 1.
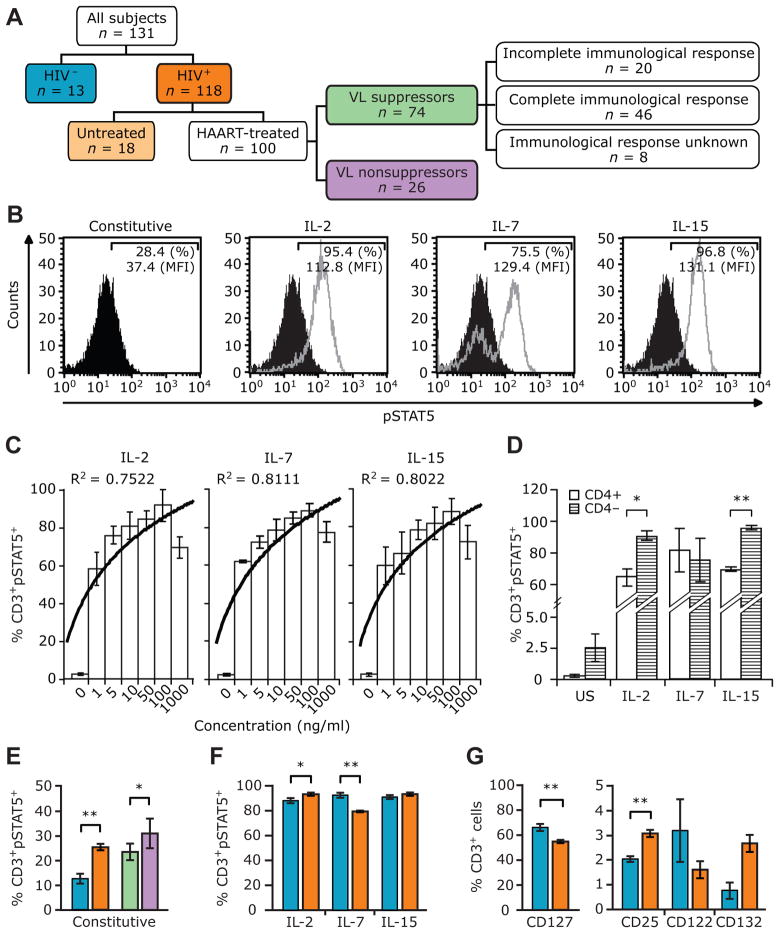
Constitutive and γ-chain (γc) cytokine-induced phosphorylated signal transducer and activator of transcription 5 (pSTAT5) levels in HIV-positive and HIV-negative subjects. A, Study groups. Unless otherwise indicated, the color codes used in this panel are used in the remainder of the panels in this figure and in figure 2. B, Representative histograms of constitutive (black) and cytokine-induced (gray) pSTAT5 levels in an HIV-positive subject. Percentages denote the percentages of CD3+ T cells that were also positive for pSTAT5. Mean fluorescence intensity (MFI) values for pSTAT5 present in CD3+ T cells are also shown. Interleukin (IL)-2, IL-7, or IL-15 responsiveness is used interchangeably with IL-2-, IL-7-, or IL-15-induced pSTAT5 and responsiveness of T cells to the indicated cytokines. C, Percentages of CD3+ pSTAT5+ cells after stimulation with increasing concentrations of IL-2, IL-7, or IL-15. Histograms and error bars denote the mean levels and 95% confidence intervals, respectively, of constitutive (denoted by “0”) and cytokine-induced pSTAT5 in CD3+ T cells. The trend line denotes a logarithmic curve fit measured and shown as R2 values. Data are from 4 different HIV-negative subjects. D, Percentages of CD3+ pSTAT5+ cells in CD4+ and CD4− (i.e., CD8+) T cells after stimulation with 100 ng of the indicated cytokines per milliliter. US, unstimulated. Data are from 3 different HIV-negative individuals, and similar results were obtained when gating on CD8+ and CD8− T cells (data not shown). E–G, Histograms and error bars denote the mean levels and 95% confidence intervals, respectively, of constitutive (E) and cytokine-induced pSTAT5 (F) and cytokine receptors (G) in the indicated study groups. P values were calculated using Student’s t test. *P<.05; **P<.01. P = .06, for the difference in CD132 expression between HIV-positive and HIV-negative subjects. Data in panels E and F are for 118 HIV-positive and 13 HIV-negative subjects, except in panel F, in which the data for IL-15 are derived for 110 HIV-positive subjects. Data in panel G are for 104 HIV-positive and 13 HIV-negative subjects, with the exception of data for CD25, which are for 97 HIV-positive subjects.

