
Fig. 1.
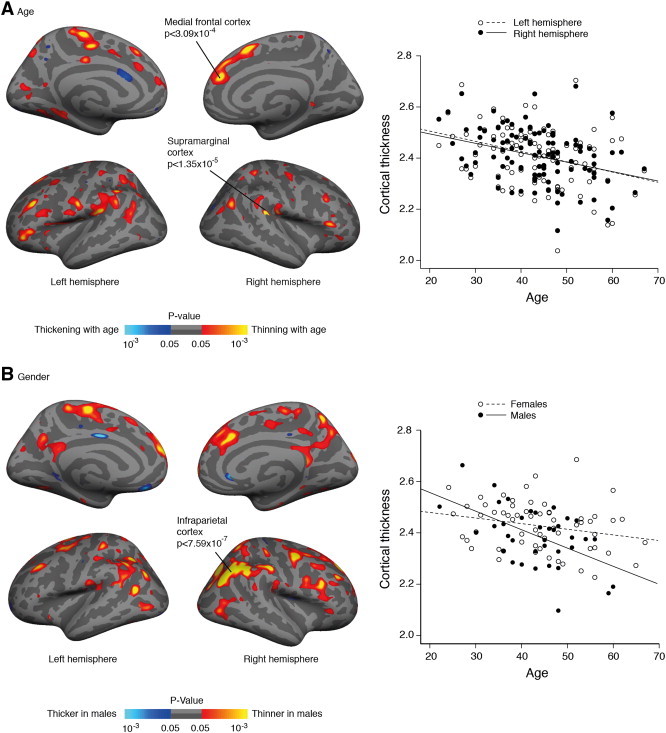
Cortical surface maps displaying a significant correlation between A) age and cortical thickness and B) gender and cortical thickness. Scatterplots represent the average cortical thickness in each hemisphere (in A) or across the whole mantle (in B). Maps are shown on an inflated standard brain in Freesurfer. For display purposes significant cortical regions are shown with a value of p < 0.05.