
Fig. 3.
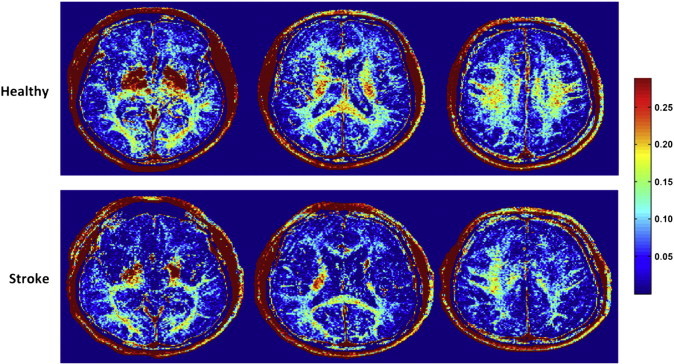
Representative slices from myelin water fraction (MWF) maps of a healthy participant (HC08) (top panel) and an individual with stroke (S09) (bottom panel). Note both local and global reductions in white matter MWF for the stroke participant compared to healthy control.