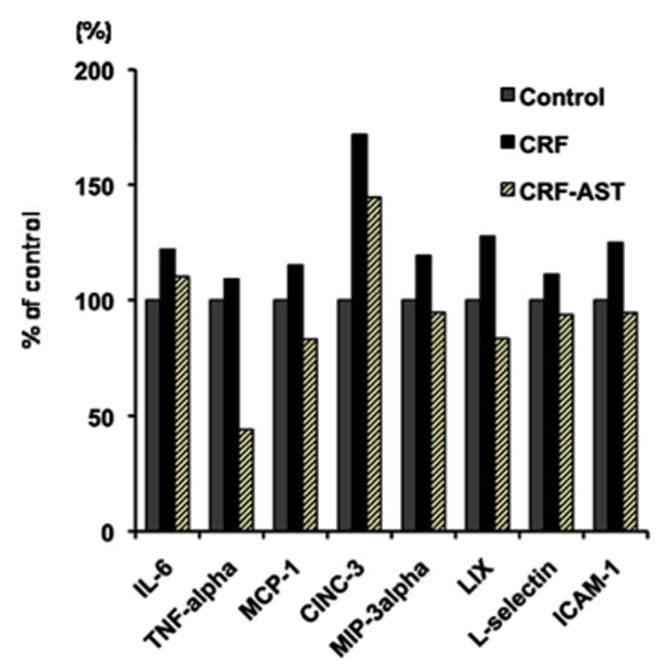
Figure 5.

Bar graphs depicting IL-6, TNF-α, MCP-1, CINC-3, MIP-3α, LIX, L-selectin, and ICAM-1 concentrations in the pooled plasma from the normal control (CTL), untreated CKD, and AST-120 treated CKD (CKD-AST) rats. The data are presented as % of values found in the pooled plasma from normal control rats.
