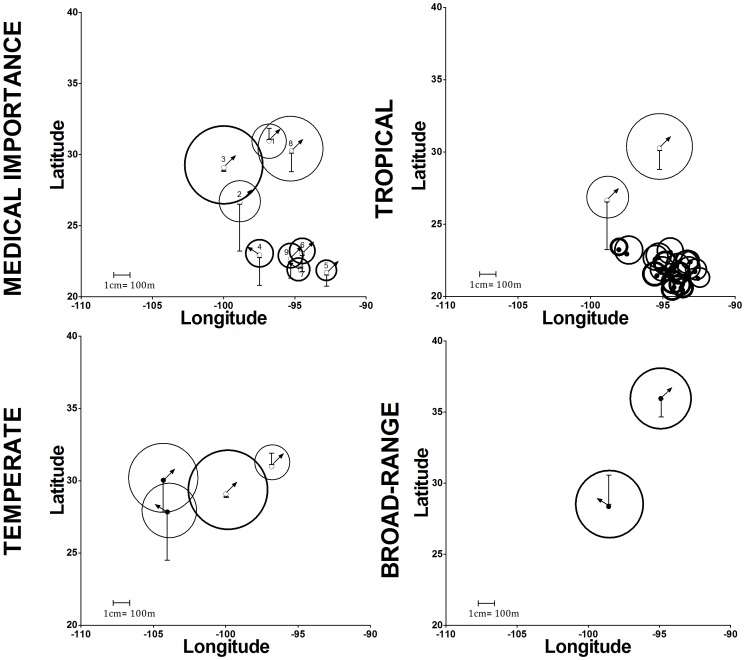
Figure 7. Changes in niche breadth, ENM centroid and elevational range in B2 scenario.
The circle size represents the proportional distribution change, while the thickness is proportional to the overlap percentage between current and 2050 projections (border thickness of 0.5 pt = 25–50%; 1 pt = 51–75%; 2 pt = 76–100%). The direction of the arrow represents the direction of change of the centroid position and its size represents its magnitude. The elevational range changes are represented by the bars (bar up = increase; bar below = decrease). Epidemiologically important species are: 1) Lu. anthophora, 2) Lu. cruciata, 3) Lu. diabolica, 4) Lu. longipalpis, 5) Lu. olmeca olmeca, 6) Lu. ovallesi, 7) Lu. panamensis, 8) Lu. shannoni and 9) Lu. ylephiletor.

