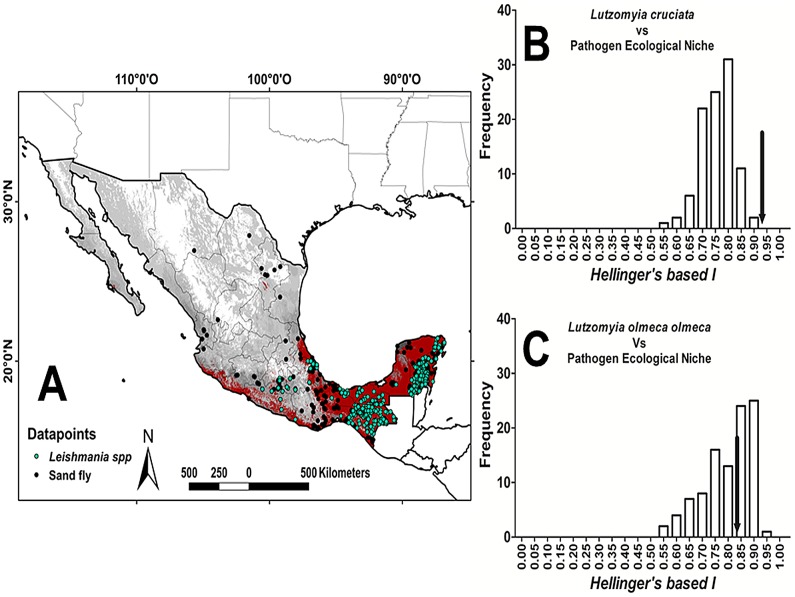
Figure 8. Niche identity test for sand fly species and Leishmania spp. (PEN), for Mexico.
A) Map of sandfly species richness (compendium of all ENM models; gray), Leishmania spp. PEN (red), and datapoints for all sand flies and Leishmania; B) Niche identity test for Lu. cruciata and PEN; C) Niche identity test for Lu. olmeca olmeca and PEN. The histograms represents the entire range of Hellinger's based I values from the 100 random-drawn models, while the observed identity is represented by a black arrow.

