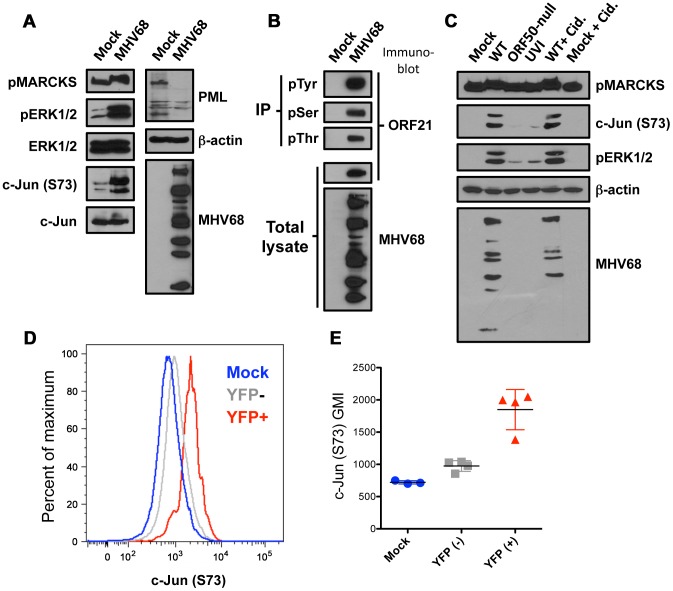
Figure 3. Biochemical validation of mass-spectrometry identified infection-related phosphorylation events.
(A) 3T3 fibroblasts were mock-infected or infected with MHV68 at MOI = 5 PFU/cell. Cells were harvested 18 h post-infection, proteins were resolved by SDS-PAGE, and immunoblot analyses were performed using antibodies to detect the indicated phosphorylated or total proteins. (B) 3T3 fibroblasts were mock-infected or infected with MHV68 at MOI = 5 PFU/cell. Cells were harvested 18 h post-infection, and phosphoproteins were immunoprecipitated using antibodies directed against p-Tyr, p-Ser, or p-Thr. Whole cell lysates (1/40th) or immunoprecipitates were resolved by SDS-PAGE. Immunoblot analyses were performed to detect ORF21 protein or MHV68 lytic antigens. (C) Cells were mock infected in the presence or absence of the antiviral drug cidofovir (Cid.), or infected with WT MHV68, UV-inactivated (UVI) MHV68, ORF50-null MHV68, or WT MHV68 in the presence of cidofovir. Cells were harvested, and immunoblot analyses were performed as in A. (D and E) Mice were intraperitoneally mock-inoculated or inoculated with 106 PFU of H2B-YFP-expressing MHV68. Animals were sacrificed 4 days post-infection, and bulk splenocytes were isolated and processed for flow cytometry to detect H2B-YFP and S73-phosphorylated c-Jun. A representative histogram (D) depicts phospho-S73 c-Jun detection levels in mock-infected (blue), H2B-YFP− cells from infected animals (gray), and MHV68 infected H2B-YFP+ cells (red). The H2B-YFP gating strategy and a comparison to productively-infected fibroblasts is shown in Fig. S3. Data graphed in (E) represent compiled geometric mean fluorescence intensities (GMI) from 3 mock-infected or 4 infected mice.

