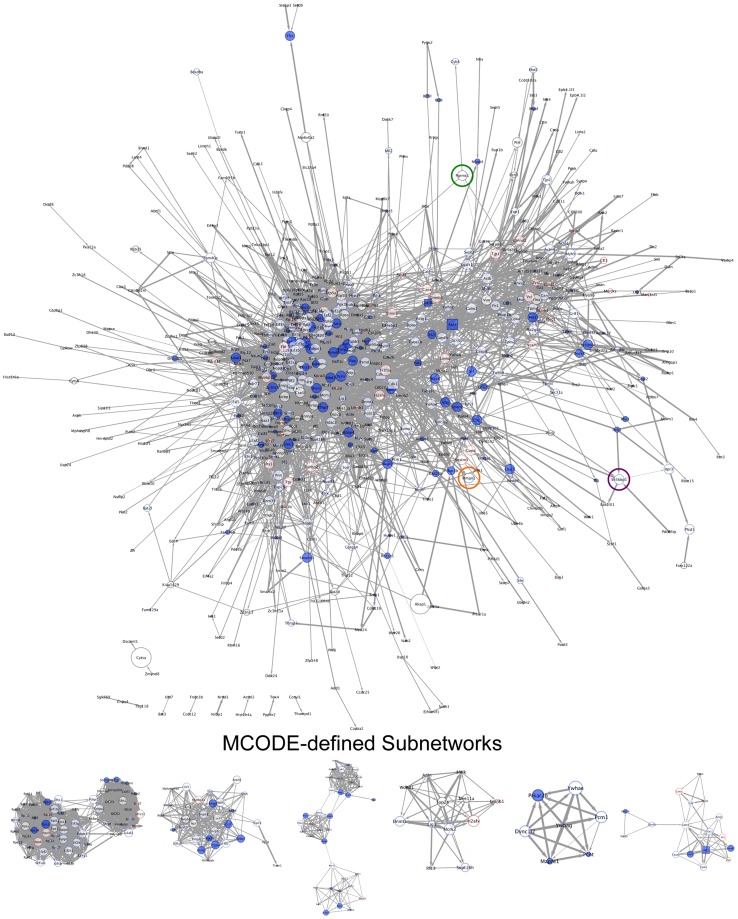
Figure 4. Global phosphoprotein network of uninfected cells.
Interaction-network analyses were performed for all proteins identified in control data sets using STRING to define a global phosphoprotein network. Standard STRING-defined confidence values of 0.40 were used as cut-offs for putative interactions. All connected nodes were imported into Cytoscape, and specific identifiers were assigned to each node according to MaxQuant values. Solid red (see Fig. 5) denotes detection only in infected cells. Solid blue denotes detection only in control cells. Red borders denote increased abundance during infection. Blue borders denote reduced abundance during infection. Black borders indicate no infection-related change in protein intensity. Gene names for each protein are shown. Kinases are depicted as square nodes. Node size corresponds to betweenness centrality, a measure of a particular node's capacity to connect disparate protein clusters within the network. Edge weight corresponds to STRING-defined confidence values, where a thicker line indicates a higher confidence prediction. Nodes highlighted with green, orange, or purple circles represent common nodes in both control and infected networks (see Fig. 5) and are provided to facilitate orientation. Subnetworks represent the 6 highest scoring functional protein clusters identified within each global network using MCODE.

