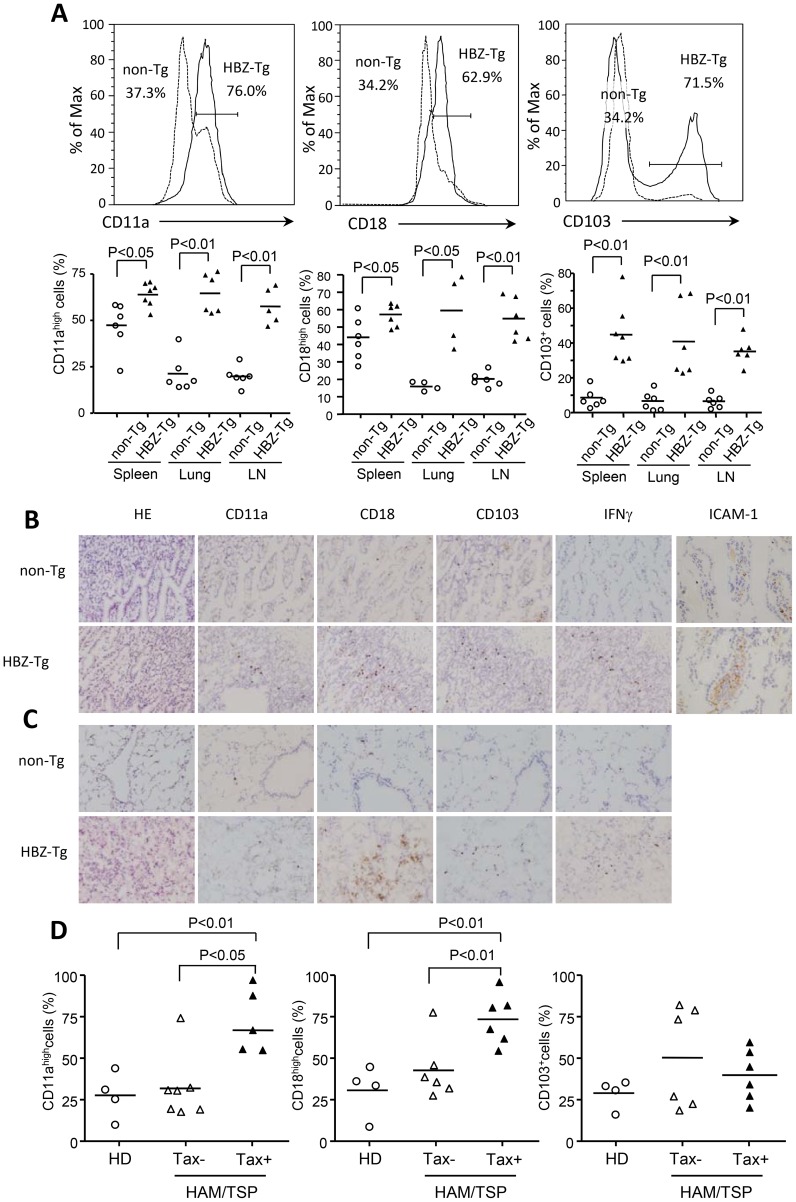
Figure 2. Expression of CD11a, CD18 and CD103 in CD4+T cells from spleen, lung and LN cells isolated from HBZ-Tg mice.
(A) The expression of CD11a, CD18 and CD103 in CD4+ T cells from non-Tg (dashed line) and HBZ-Tg (solid line) mice was analyzed by flow cytometry. Histograms from one representative mouse splenocytes of each group are shown (top panels). The bottom panel shows the results of 4 or 6 mice in each group, each symbol representing an individual mouse. The small horizontal lines indicate the mean. Frozen sections of intestine (B) and lung (C) of non-Tg and HBZ-Tg mice were stained with HE and the indicated antibodies. Original magnification is ×20. Results from one representative mouse of each group are shown. (D) CD11a, CD18 and CD103 expressions are shown on CD4+ cells from HDs, CD4+Tax− and CD4+Tax+ cells from HAM/TSP patients.

