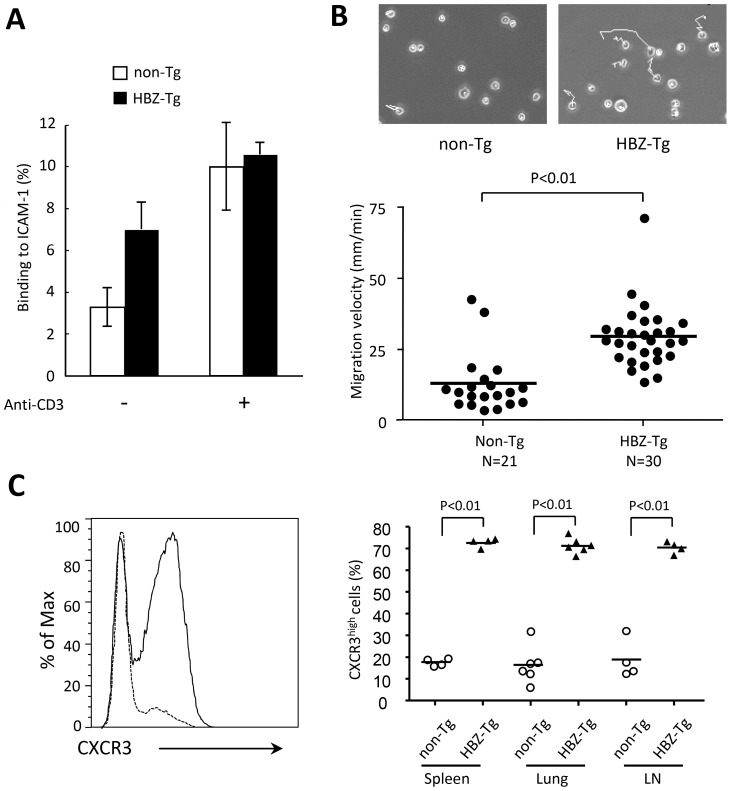
Figure 3. Enhanced capacity for cell adhesion and migration of CD4+splenocytes isolated from HBZ-Tg mice.
(A) Assays of cell adhesion to mouse ICAM-1 were performed using purified mouse CD4+splenocytes of HBZ-Tg or non-Tg mice. Results shown are means ± s.d. of triplicate wells. (B) Random CD4+ mouse splenocyte migration was recorded at 37°C with a culture dish system for live-cell microscopy. Phase-contrast images were taken every 15 seconds for 10 min. The cells were traced and migration velocity was calculated. Each dot represents the velocity of an individual cell, and bars indicate the mean (n = 21 for non-Tg, n = 30 for HBZ-Tg). Statistical analyses were performed using an unpaired, two-tailed Student t-test. (C) Representative histograms of CXCR3 expression in CD4+ T cells from non-Tg (dashed line) and HBZ-Tg (solid line) mice (left) and cumulative results from 4 or 6 mice are shown in the graph (right) for spleen, lung and lymph node. Each symbol represents an individual mouse; small horizontal lines indicate the mean.

