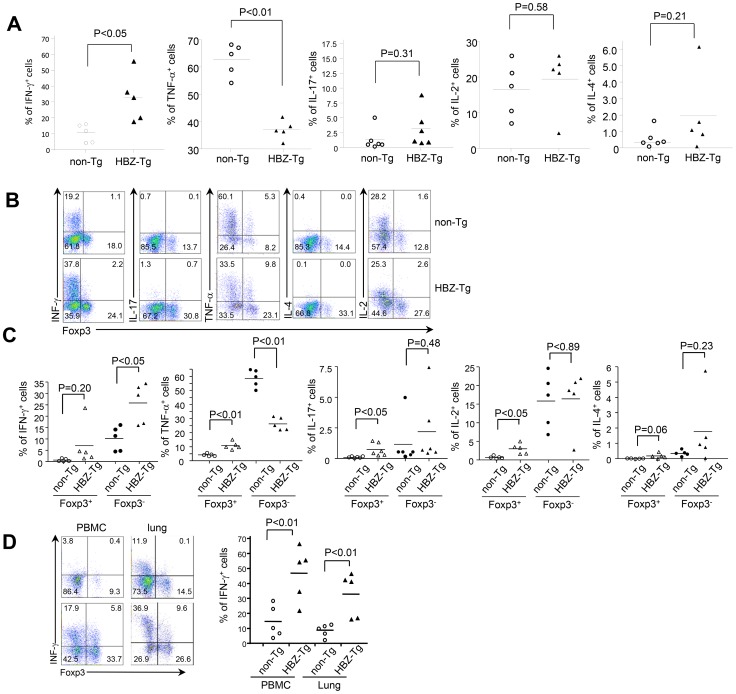
Figure 4. Production of cytokines in HBZ-Tg mice.
(A) Splenocytes of HBZ-Tg mice or non-Tg mice were stimulated with PMA/ionomycin and protein transport inhibitor for 4 h. IFN-γ, IL-17, TNF-α, IL-4 or IL-2 production was analyzed in CD4+ T cells by flow cytometry. (B) Cytokine production was analyzed along with Foxp3 expression. (C) Production of cytokines was shown in CD4+Foxp3+ T cells and CD4+Foxp3− T cells. (D) IFN-γ and Foxp3 expression gated on CD4+ T cells from PBMC or cells isolated from the lungs were analyzed by flow cytometry. Percentage of IFN-γ+ cells in CD4+ splenocytes, PBMC and lung cells. Each symbol represents an individual mouse; small horizontal lines indicate the mean.

