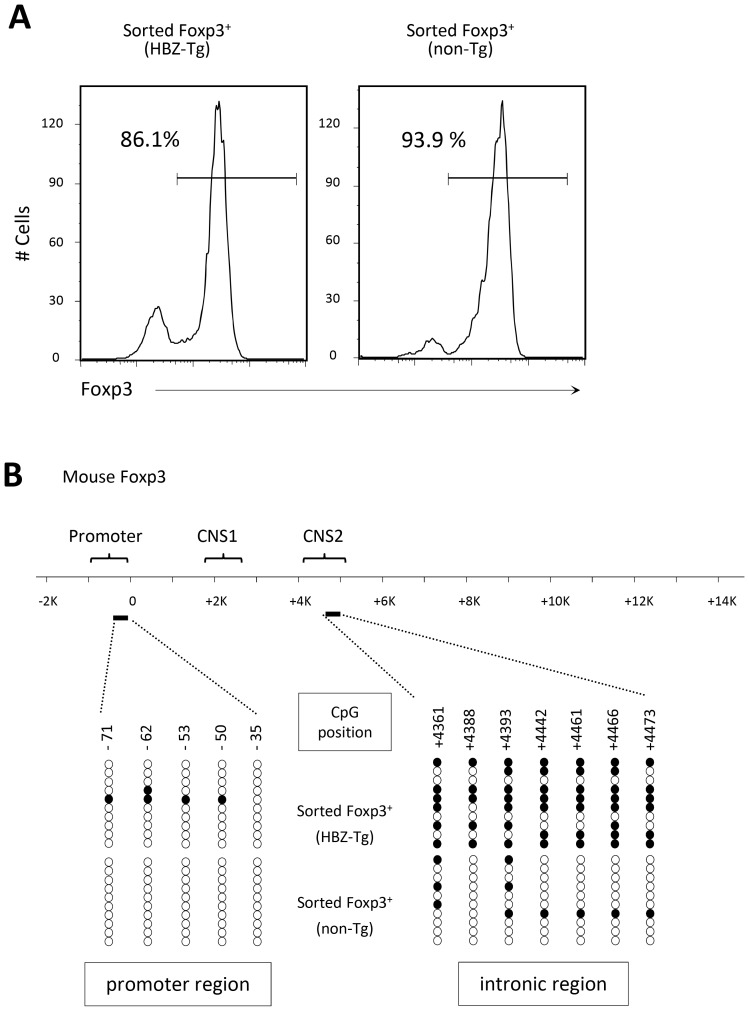
Figure 6. DNA methylation status in the promoter and intronic CpG island region of the Foxp3 gene.
(A) The purity of the isolated Treg cells, sorted from the spleens of male mice, was confirmed by staining the intracellular expression of Foxp3 and analysis by flow cytometry. (B) DNA methylation status in the indicated regions was determined by bisulfite sequencing. Each line represents one analyzed clone; open circles, unmethylated CpGs and filled circles, methylated CpGs.

