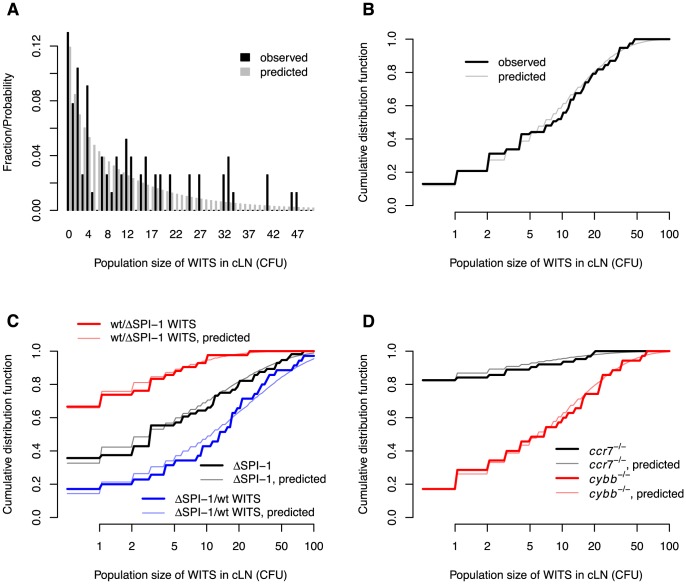
Figure 3. Comparison between the observed and predicted population sizes of the WITS.
A. Comparison of observed and predicted wild type WITS population size distributions in wild type mice. B. The same comparison, but cumulative distribution functions of the WITS population sizes are shown. C. Comparison of observed and predicted WITS population size distributions in wild type mice for experiments involving  . D. Comparison of observed and predicted WITS population size distributions in
  and
and  mice. The model predictions are based on the maximum likelihood estimates in Table 1.

