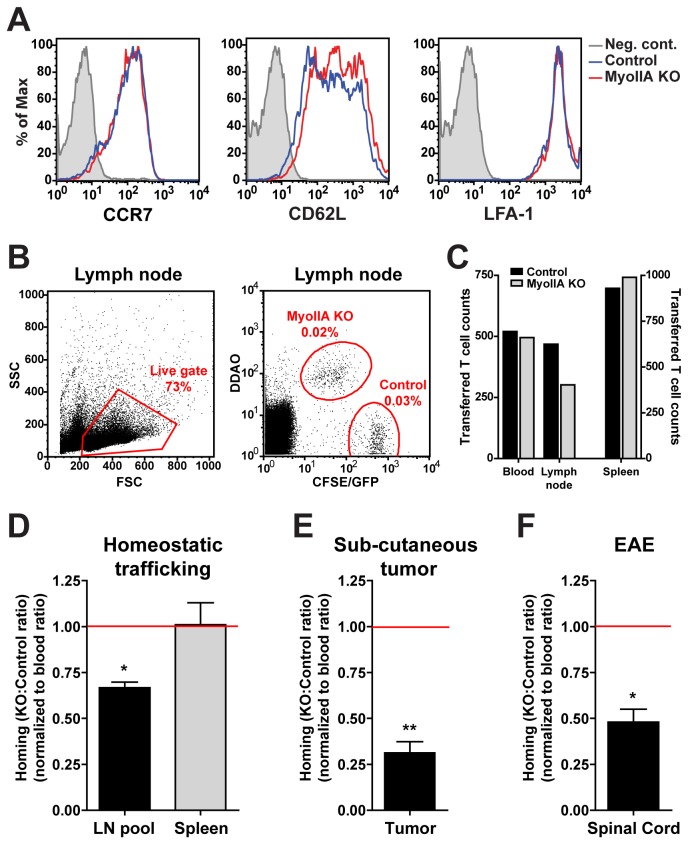
Figure 6. MyoIIA deficiency in activated T cells causes homing defects during homeostatic and inflammation-driven trafficking.
A) Chemokine receptor and adhesion molecules are similarly expressed on control and MyoIIA KO activated T cells. Flow cytometry expression profile of CCR7, CD62L and LFA-1 of control and MyoIIA KO activated T cells. Data in A is representative of 2 independent experiments. B-C) Representative examples of flow cytometry analysis and quantification of transferred T cell homing in vivo. Control and MyoIIA KO T cells were labeled with different fluorescent dyes and transferred intravenously into recipient mice, 18h post-transfer tissues were harvested and the number of transferred cells was quantified. Examples of transferred T cell flow cytometry gating (B) and enumeration (C) are shown. D-F) Reduced tissue homing of MyoIIA KO activated T cells in vivo. The ratio of intravenously transferred MyoIIA KO vs. control T cells from dissociated tissues was quantified by flow cytometry and normalized to the ratio in the blood. A ratio below 1.0 indicates impaired entry of MyoIIA KO cells into the indicated tissue. D) Quantification of MyoIIA KO activated T cell homing to lymph nodes and spleen of untreated recipient mice 18h post-transfer. Data in D are the mean (±SEM) of 4 independent experiments. E) Homing of MyoIIA KO T cells to ectopic sub-cutaneous tumors 18h after intravenous transfer, quantified by flow cytometry. Data in E are the mean (±SEM) of 3 independent experiments. F) Reduced homing of MyoIIA KO T cells to the spinal cord of recipient mice with ongoing EAE 24h after intravenous transfer. Data in F are the mean (±SEM) of 3 independent experiments. * p<0.05 and ** p<0.01.

