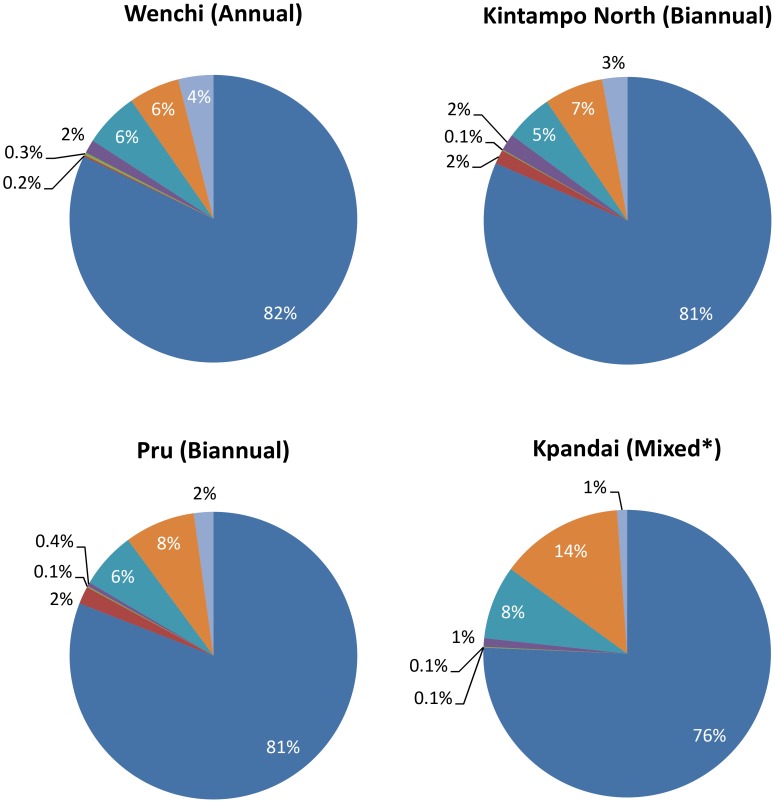
Figure 3. Economic costs at district, sub-district, and community levels disaggregated by resource type (excluding CDDs' time).
Personnel (dark blue); Per Diems (red); Supplies and Equipment (Capital costs) (green); Supplies and Equipment (Recurrent costs) (purple); Transportation (Capital costs) (turquoise blue); Transportation (Recurrent costs) (orange); Overheads (light blue). Definitions of different resource types are given in Box 2. *Data from Kpandai district reflect a combination of annual and biannual treatments.

