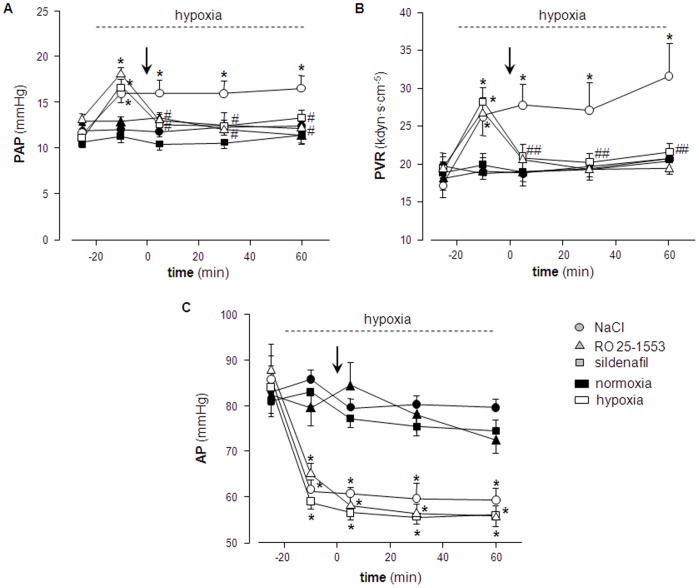
Figure 2. Inhaled RO 25-1553 attenuates HPV in the absence of systemic cardiovascular effects in vivo.
Group data showing A) mean pulmonary artery pressure (PAP), B) pulmonary vascular resistance (PVR), and C) mean systemic arterial pressure (AP) in rats at normoxic baseline (t = –25 min), after switch to hypoxic ventilation (11% O2, open symbols) or during continued normoxic ventilation (21% O2, black symbols), respectively (t = –10 min), and 5, 30 and 60 min following a 3 min inhalation of either 0.9% NaCl (circles), RO 25-1553 (1 mg·mL−1; triangles) or sildenafil (10 mg·mL−1; squares). Interval of hypoxic ventilation (for hypoxia groups) is indicated by dashed line, time of drug inhalation (t = 0 min) by arrow. Lines connecting individual data points serve assignment to the different study groups and do not reflect exact time course of parameters. Data are means±SEMs; * p<0.05 vs. corresponding normoxia group, # p<0.05 vs. NaCl group under similar ventilation; n = 8 experiments each.

