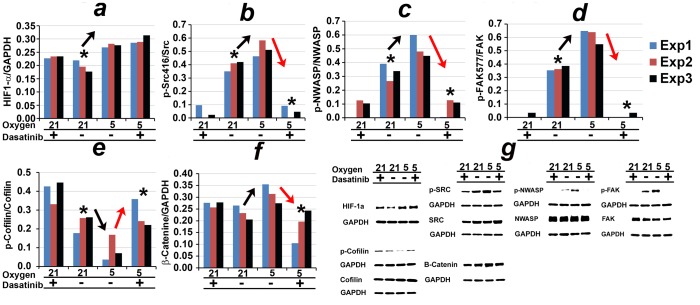
Figure 4. Molecular discovery in U251 cells.
Shown are the expression levels of molecules, p-Src-416, p-NWASP, p-FAK-577, p-Cofilin, and  -Catenin, which survived Rules 1 and 2 (see Figure 3). Normalized protein expression ratios from each of the three experiments is indicated by a different color (Exp1, Exp2, Exp3). The y-axes of (a)-(f) indicate
  ,
,  ,
,  ,
,  ,
,  , and
, and  , respectively. (g) shows representative western blots. * indicates a two-sample two-tailed ttest p<0.05 in the group indicated as compared to vehicle in 5%. Black and red arrows indicate Rules 1 and 2, respectively.

