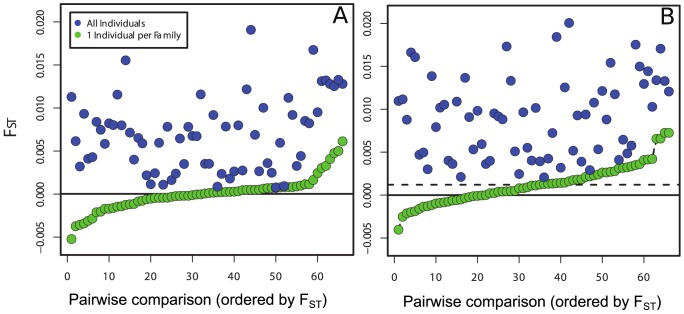
Figure 2. Calculations of pairwise FST between A. simulated and B. empirical schistosome infrapopulations of 12 human patients as measured by sampling schistosome offspring rather than adults.
Both plots show the pairwise comparisons of the raw, uncorrected samples (blue) and those of the same samples corrected using the one-per-family method described in the manuscript (green). Pairwise comparisons are ordered by FST value on the X-axis. Note that in both plots, the FST values of the corrected dataset are lower (or equal to) the FST values from the raw samples showing the predicted inflation caused by family structure in the raw samples. Also note the mean FST indicated by the dashed line is slightly greater than 0 for the empirical samples, which suggests that a small amount of residual FST was not removed by the correction. Whether this represents true FST among patients or a failure of COLONY to accurately identify all sibship is unknown.

