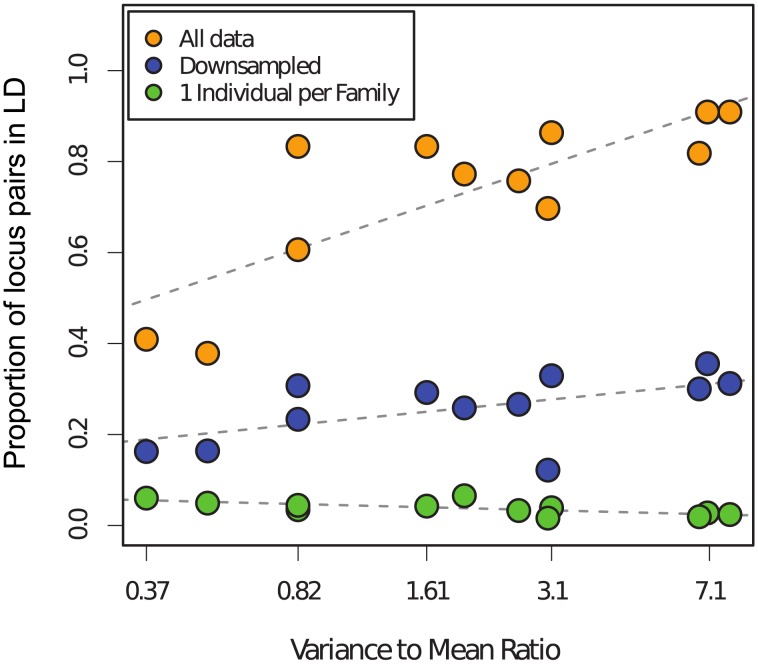
Figure 4. Linkage disequilibrium (LD) between pairs of microsatellite loci within samples of schistosome offspring collected from 12 human patients compared to the amount of family structure present in each dataset.
Amount of LD is represented by the proportion of locus pairs in disequilibrium (see text for statistical tests). Family structure is represented by the log-transformed variance to mean ratio of family size (VMR), but plotted on their actual values. LD is shown for each raw dataset (orange), samples corrected for family structure using the one-per-family approach (see text) (green), and the raw samples that were resampled to equal the sample size of the corrected samples (blue). Note the positive relationship between LD and VMR in the raw samples and the near-complete reduction in the corrected samples.

