
Figure 2. Recovery kinetics of the isometric torque: average isometric torque of the plantarflexors before immobilization (I0) and 7, 21 and 42 days after cast removal (R7, R21 and R42, respectively).
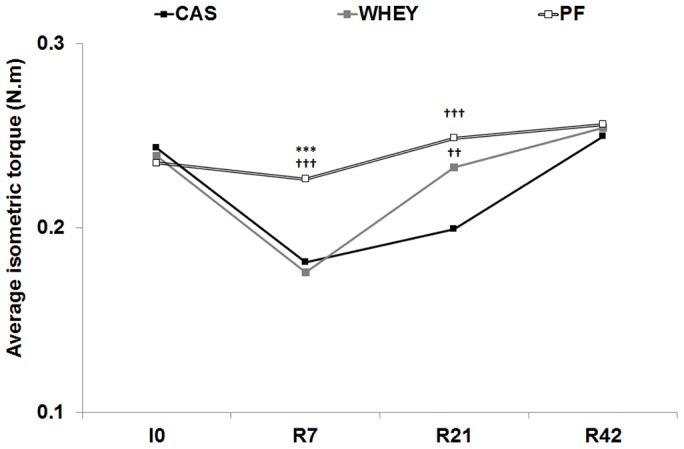
Recovery kinetics are shown for the experimental groups fed with casein (CAS), whey (WHEY), and in the pair-fed control group (PF). Significantly different from WHEY: ***: P<0.001. Significantly different from CAS: ††: P<0.01; †††: P<0.001. Standard errors not shown for the sake of clarity.