
Figure 4. Recovery kinetics of the power-velocity relationship: power-velocity relationship after 7 (R7; panel A), 21 (R21; panel B) and 42 days (R42; panel C) of recovery in the experimental groups fed with casein (CAS; black bars), whey (WHEY; grey bars), and in the pair-fed control group (PF; white bars).
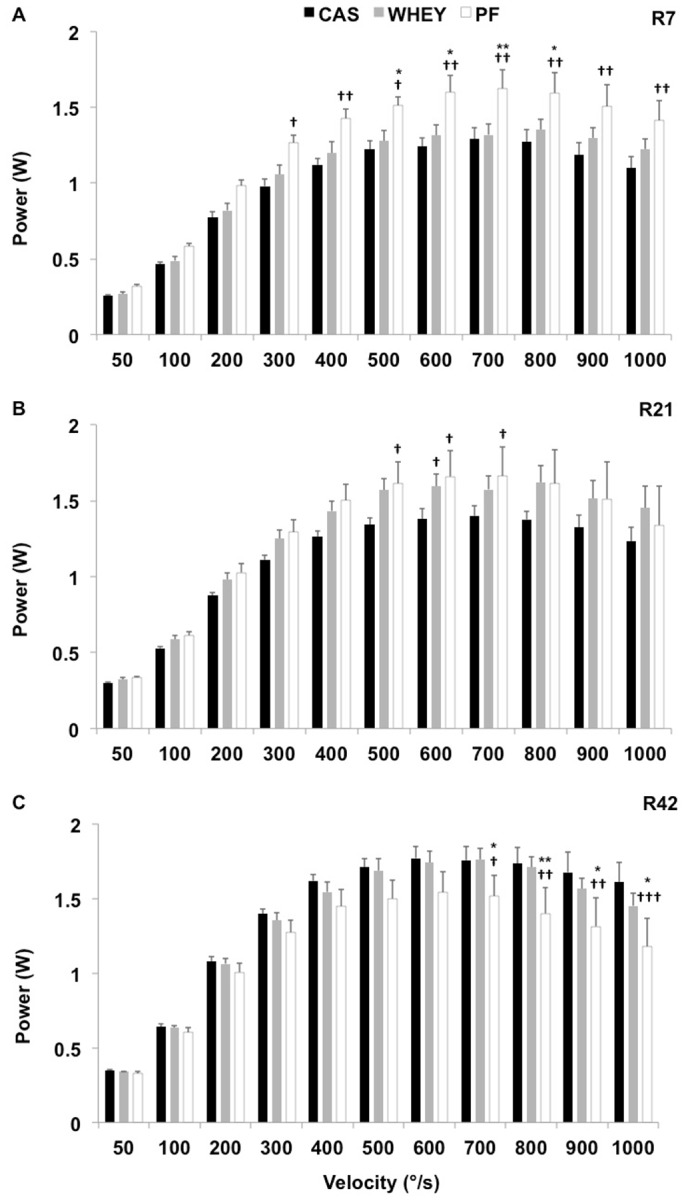
Significantly different from WHEY: *: P<0.05; **: P<0.01. Significantly different from CAS: †: P<0.05; ††: P<0.01; †††: P<0.001.