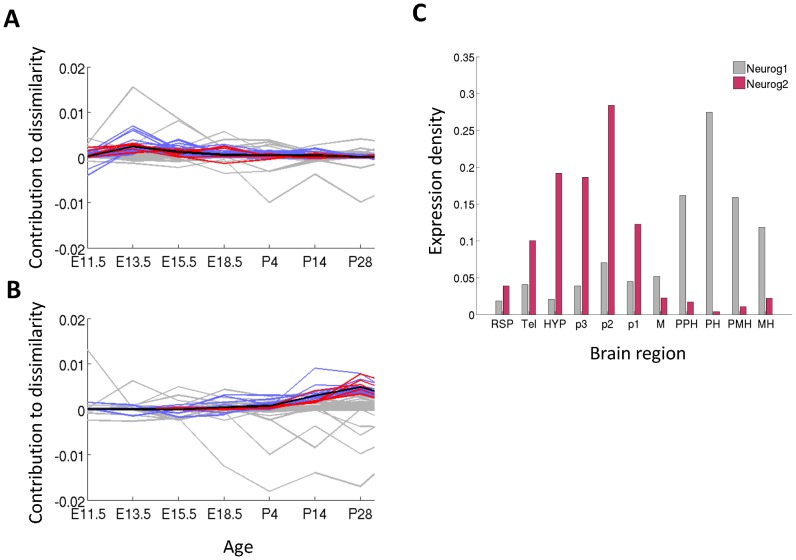
Figure 2. Functional characterization of hourglass shape.
(A), (B) Clusters of gene profiles that are functionally enriched. Each profile is a measure of contribution to dissimilarity D (see Methods). Black bold curve is the mean of the cluster. Blue lines - all the genes in the cluster; red lines - genes that are in the cluster and in the category; grey lines - genes that are not in the cluster even though belong to the category. (A) Neuron migration shows decreasing dissimilarity (B) Learning or memory shows a post-natal increase in dissimilarity. (C) Spatial expression of the genes Neurog1 and Neurog2 at E11.5 in 11 coarse regions, selected as neuron differentiation genes with highly similar sequence.

