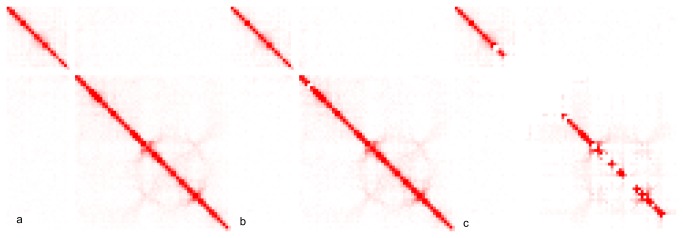
Figure 3. Normalization of chromosome 17 Hi-C data according to the Lieberman-Aiden et al. experiment.

In panel a) the Hu et al. normalization is shown, while in panel b) the read-based normalization performed with NuChart (threshold 0.9) is presented to show the reproducibility with respect to the Hu et al. approach. Panel c) represents the NuChart read-based normalization performed using a more restrictive threshold (threshold 0.99).
