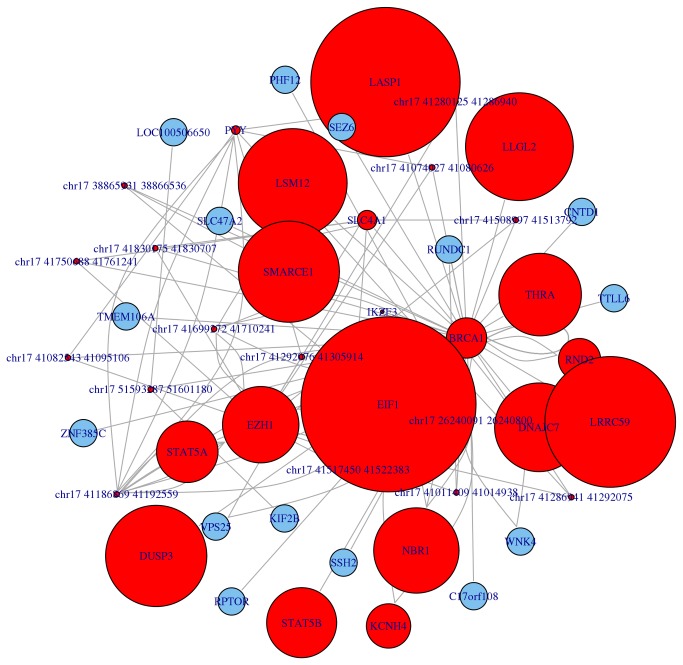
Figure 4. Neighbourhood graph of the gene BRCA1 according to the Lieberman-Aiden et al. experiment.
Gene expression data about colon cancer experiment GDS3160 have been mapped on the graph to show the enhanced description (and prediction) power that the graph representation has in relation to gene co-expression with respect to the approach relying on genomic coordinates.

