
Figure 6. Serological responses from mice infected with TCB-1 (A and B) and FCB-1 (C and D).
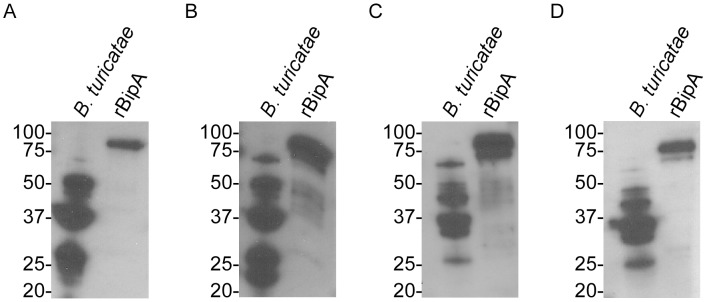
B. turicatae protein lysates and rBipA produced from the 91E135 isolate are shown. Molecular masses are indicated to the left of each immunoblot in kilodaltons.